
Tissue Segmentation
Context: Machine Learning Engineer Intern · Functional Genomics Laboratory Regensburg · 2024
Focus: Unsupervised learning · High-dimensional scientific data · Spatial clustering
I developed a machine-learning workflow for identifying tissue regions and molecular patterns in DESI mass-spectrometry imaging (DESI-MSI) data.
The task combined scientific data engineering with unsupervised learning: raw molecular-intensity measurements first had to be cleaned and transformed into an analysis-ready representation before PCA and K-means clustering could reveal spatial structure.
View the public implementation on GitHub →
Project snapshot
| Metric | Result |
|---|---|
| Data-footprint reduction | 40% |
| PCA selection criterion | 95% explained variance |
| Tissue segmentation | 4-cluster K-means |
| Validation | Consistency across follow-up scans |
| Public sample PCA result | 15 components ≈ 99% explained variance |
| Learning setting | Unsupervised |
The challenge
Mass-spectrometry imaging records a molecular spectrum at each spatial coordinate. This creates a high-dimensional dataset in which every point can contain many molecular-intensity features.
The goal was to identify spatially coherent tissue-related regions without manually annotated tissue labels.
The main challenges were therefore:
- cleaning large scientific exports,
- removing redundant information,
- reducing dimensionality while retaining molecular variation,
- selecting a useful clustering structure,
- mapping cluster assignments back to spatial coordinates,
- checking whether the resulting regions remained meaningful across follow-up scans.
Data preparation
I built Python-based preprocessing steps for cleaning, restructuring and analysing the MSI data.
Through data cleaning, redundancy removal and optimized export, the high-dimensional data footprint was reduced by approximately 40% before downstream analysis.
The public implementation supports several exported MSI table structures, including:
- transposed feature tables,
- tab-separated exports,
- removal of metadata columns,
- extraction of spatial X/Y coordinates,
- separation of raw and processed data.
After preprocessing, each observation is represented by spatial coordinates and a vector of molecular-intensity features.
Raw DESI-MSI export
        ↓
Cleaning and restructuring
        ↓
Spatial coordinates + molecular features
        ↓
PCA
        ↓
K-means clustering
        ↓
Spatial cluster map
        ↓
Follow-up scan comparison
Dimensionality reduction with PCA
The molecular feature space was reduced with Principal Component Analysis before clustering.
For the internship analysis, I used a 95% explained-variance threshold to retain the dominant molecular variation while reducing the dimensionality of the clustering problem.
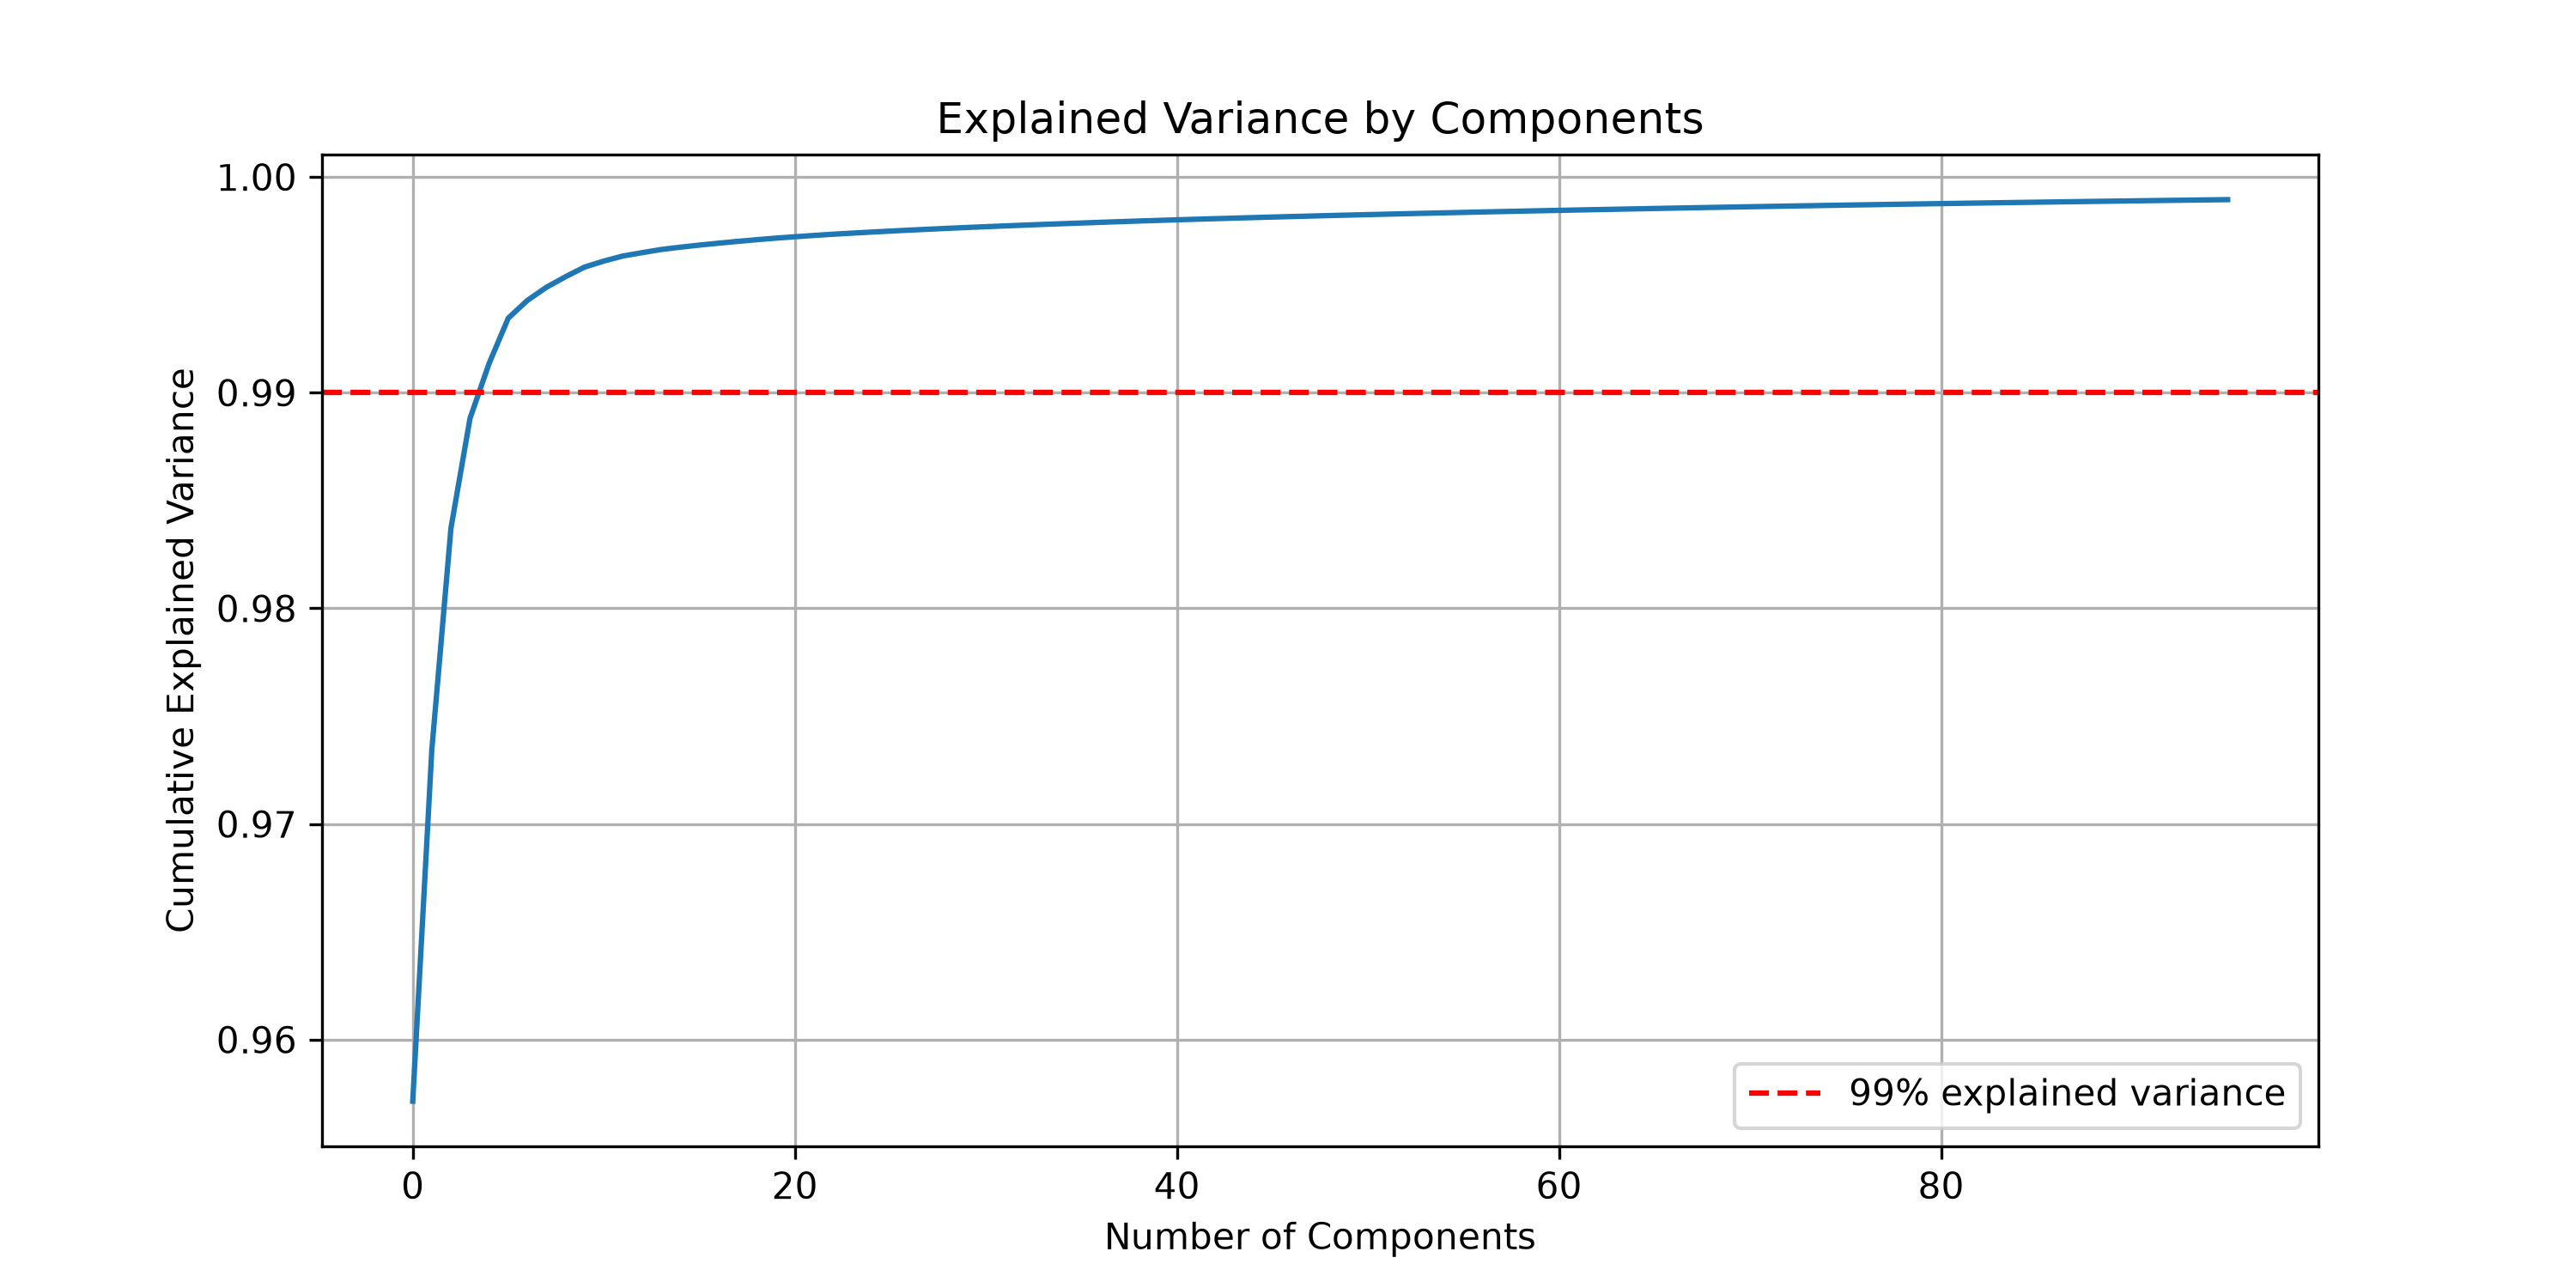
The public repository also includes cumulative explained-variance analysis. On one included sample dataset, approximately 15 principal components were sufficient to explain 99% of the variance.
Tissue-region detection with K-means
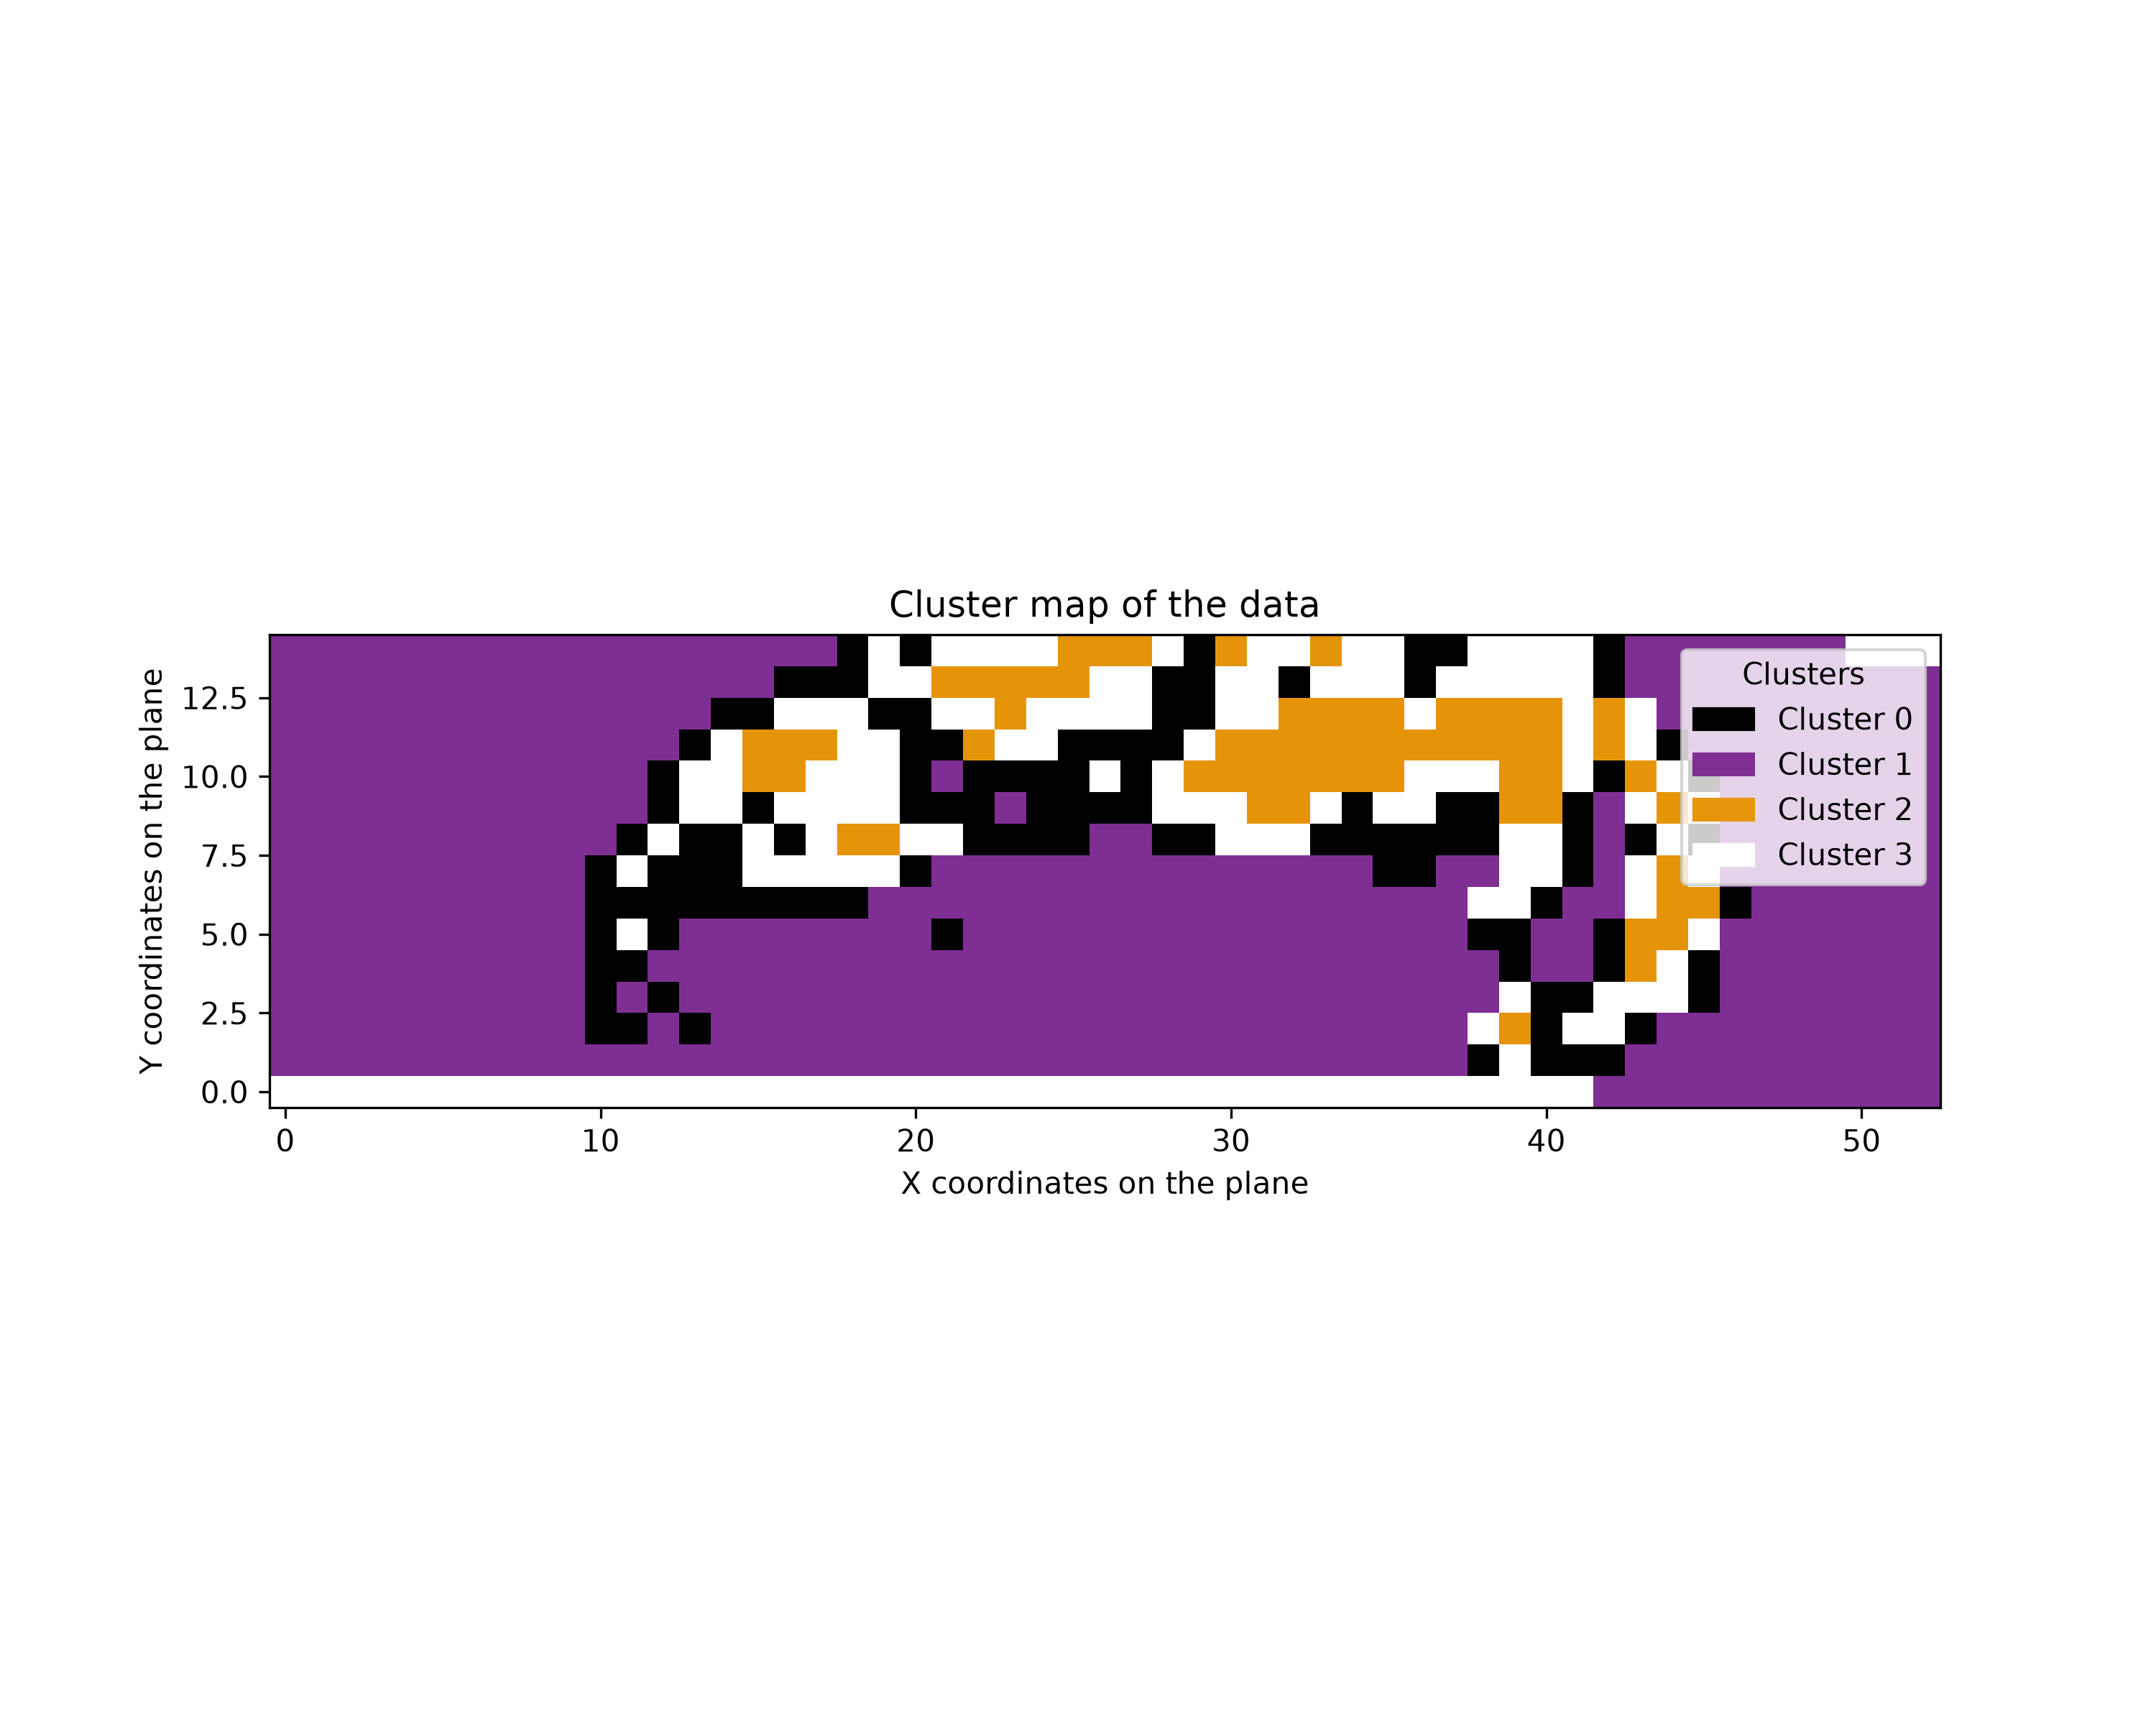
I applied K-means clustering with four clusters to identify spatially distinct tissue and molecular-density regions.
Cluster assignments were then mapped back to the original X/Y coordinates to generate spatial segmentation maps.
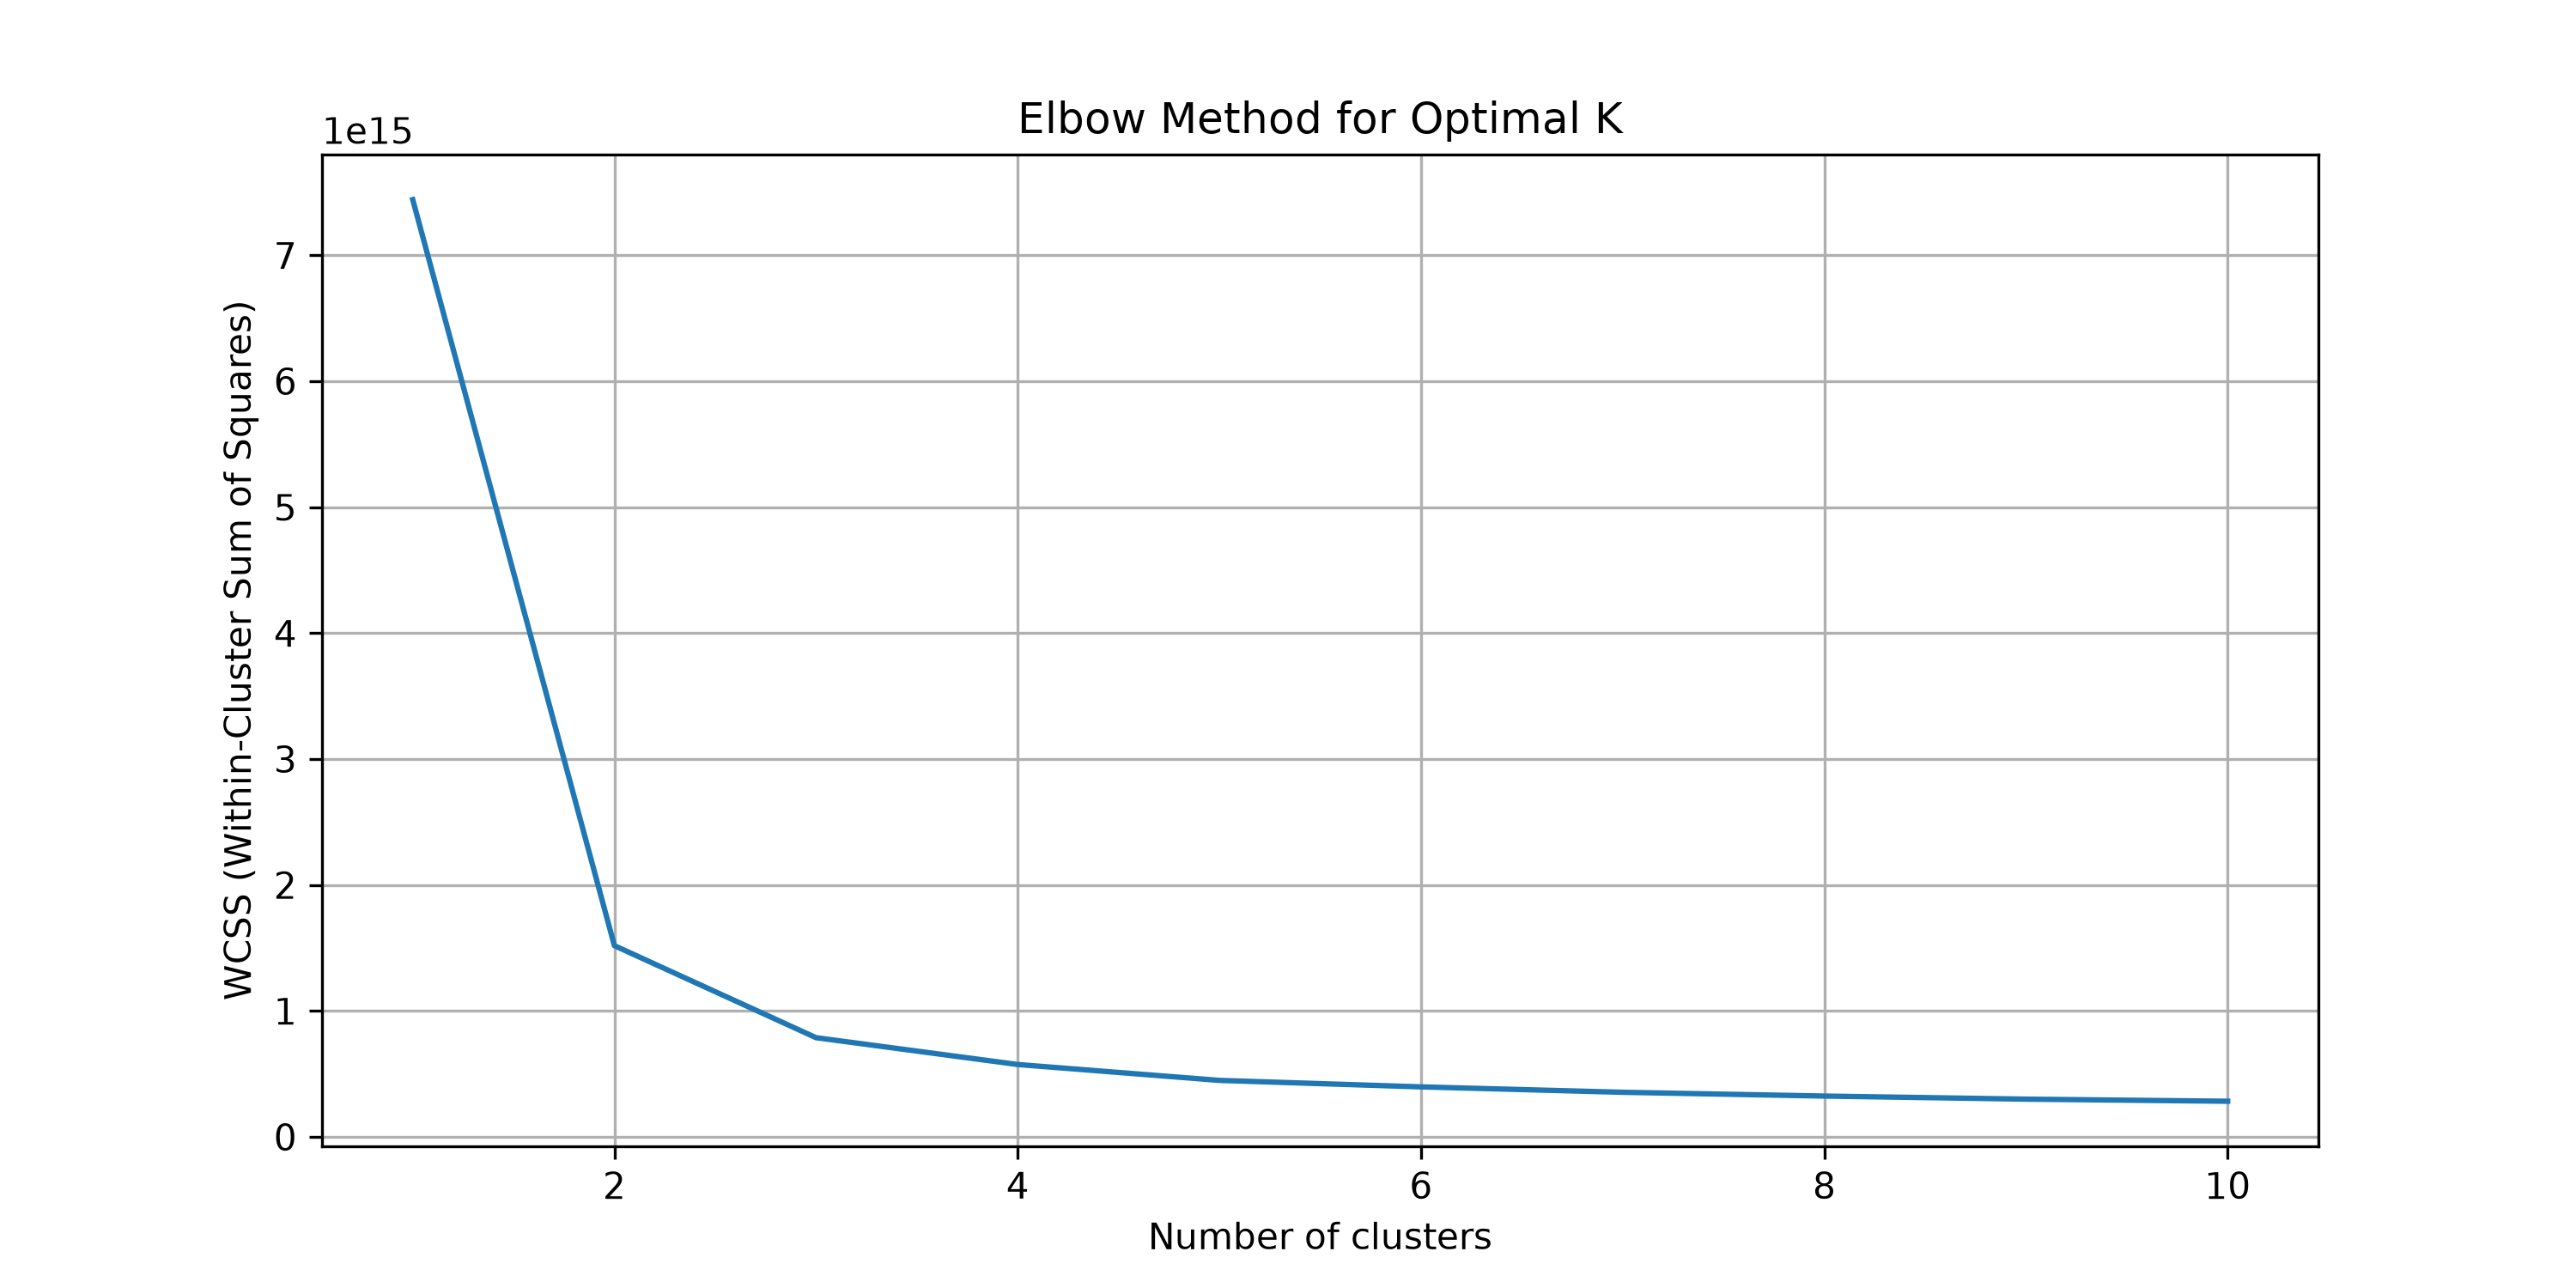
The public implementation also includes an elbow-method workflow for inspecting within-cluster sum of squares across candidate values of k.
A representative spatial cluster map from the public implementation:
Validation across follow-up scans
Because this was an unsupervised segmentation task, the work was not evaluated with a conventional labelled classification accuracy.
Instead, I checked whether the identified tissue regions and anomalous molecular patterns remained consistent across follow-up scan series, using molecular-density distributions and spatial visualisations to compare the results.
This made the clustering output useful for scientific interpretation rather than treating K-means labels as an end result by themselves.
Engineering the workflow
The public version was structured as a reusable Python project rather than a single analysis notebook.
It separates the workflow into dedicated modules for:
- data loading and preprocessing,
- PCA and explained-variance analysis,
- K-means clustering,
- cluster utilities,
- spatial visualisation,
- configuration and output handling.
The repository also separates raw data, processed data and generated figures, making the analysis easier to reproduce and extend.
What I contributed
- Built preprocessing and statistical-analysis workflows for high-dimensional DESI-MSI data.
- Reduced the processed data footprint by approximately 40%.
- Applied PCA using a 95% explained-variance threshold.
- Performed four-cluster K-means tissue segmentation.
- Mapped cluster assignments back into spatial tissue visualisations.
- Compared molecular-density patterns across follow-up scans.
- Developed a public, modular Python implementation of the preprocessing, clustering and visualisation workflow.
What this project demonstrates
This project shows my ability to work with high-dimensional, noisy scientific data where the correct ML workflow starts before model fitting.
It combines data engineering, dimensionality reduction, unsupervised learning, quantitative inspection, spatial visualisation and domain-driven validation.
Core technologies: Python · pandas · NumPy · scikit-learn · PCA · K-means · Matplotlib · Scientific Computing · Mass-Spectrometry Imaging